But if you see from 6-8 months market is moving in the trend line only...
For example May 2010 market moved in negative trend & after that is moving in +ve trend. This trend will face strong resistance at 5380-5400 levels and may continue till 5500 levels. But above 5500 level this trend line will break so psychologically Nifty may not cross it easily. Breaking that level leads fresh bull rally in markets but which may require global support as well strong quarterly results...

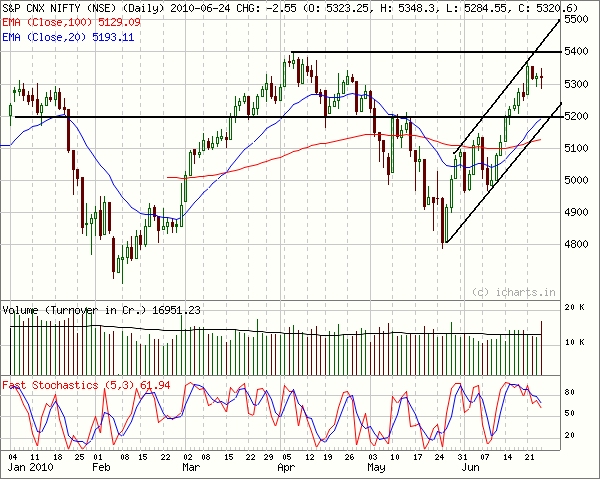 If you see the above chart it has support level at 5250 according to trend line & as well as Exponential Moving Average @5190-5200 levels. If you see recent stochastic its leading to little correction which is supported by high volume.
And at the same time if you see broader trend from October 2009 to till now market is the range of 4600 to 5550 levels. Market is not able break this trend & leading to a long consolidating for coming days.

Bottom line:
So I think instead of focusing on market returns investors should spot some mid caps & small caps to good returns as compared to consolidating broader markets.
No comments:
Post a Comment