Friday, January 28, 2011
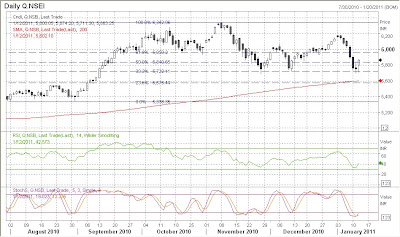
First time in 9 months Nifty closed below 200 day moving average
When Nifty started correcting from 6000 levels in November which is also 23.6% retracement level in Fibonacci retracement from top 6350 levels. From November Nifty started making bear market trend which is shown in the graph. At present that trend-line is ending at 5400 levels which is also 61.8% retracement level in Fibonacci and also Nifty has consolidated at this level for 2 months in July and August in 2010.
And also we can observe similar trend-line in RSI, where line meeting top line, line meeting intermediate top line and line meeting bottom lines are indicating the correction.
Interestingly, I got a graph (from one of the blog which I follow) which shows DIIs (Domestic Institutional Investors) and FIIs (Foreign Institutional Investors) price action and Nifty movement. From the below picture we can observe that in last 15days FIIs were net sellers almost everyday and Nifty either corrected or consolidate everyday in conjunction with FII flows.
Wednesday, January 26, 2011
Today's Mint Column On Similar Note of My Last Post About Indian Economy Overheating
A losing bout with inflation
With high-inflation expectations and an unceasing march of prices, India is close to a wage-price spiral
Since the new year began, the Indian stock market has fallen 8% below its December peak of 20,509 points. Long bond yields have risen by more than 20 basis points, touching 8.2%. Foreign investors have reduced their weights on Indian investments and capital inflows have turned into a trickle.
Effectively, India stands derated. The persistence of inflation is triggering the rethink. As the feeling that policymakers have no control over inflation gathers force, their macroeconomic stewardship is under question: It didn’t help when the government indicated that usual regulatory measures were ineffective in containing inflation, expressing its helplessness. For these reasons alone, the central bank has to now raise its hand and say “I can”.
There are other reasons, too, for further monetary action. While 36% (3.1 percentage points) of the 8.4% year-on-year rise in the Wholesale Price Index (WPI) in December resulted from food prices, manufacturing inflation accounted for 34% (2.9 percentage points). The persistence in food price inflation, however—a 13.5% increase over December 2009—is now prompting doubters to suspect that strong demand factors could be at play: The prices of vegetables, fruits and other food items are flexible and what if rapid economic growth is also pushing up prices? After all, this year has been nowhere like 2009 when the worst drought in three decades caused temporary supply disruptions. Price spikes due to some vegetable crops harmed by excessive rainfall—which is the case in the last two months of 2010—are temporary and should not be reflected in higher prices of other food items.
Ahead, accelerating commodity prices abroad are a serious risk to core inflation. Some domestic prices—auto and consumer durables— have already risen, following higher input prices; other final prices are likely to follow as margin pressures build up. There’s little spare capacity as utilization levels reached 98% in October, according to a National Council of Applied Economic Research survey. The momentum in bank credit growth indicates strengthening economic activity; the annualized, three-month moving average (deseasonalized) almost doubled to 30.9% between October and December 2010 while year-on-year growth averaged 23% in the same period. Though deposit rates have picked up—deposits grew at 19% year-on-year in December—savers are still getting little returns in real terms. The money multiplier shrank further to 4.8%. The action, therefore, remains in gold and real estate: Bloomberg reported recently that gold imports into India rose to a record high in 2010 and property prices escalated beyond pre-2007 levels in some places.
Public spending continues to be expansionary and it’s unrealistic to expect cuts, given the pattern this year. Even though the fiscal deficit target will be met this year, the inflated nominal gross domestic product (GDP) and tax revenue targets do not fool anybody, nor do the contributions made by one-time, non-tax revenues. The pity is that some of this could have been diverted towards productive investments in agriculture to signal strong determination to tackle food prices; just a beginning— however small—to address the infrastructure deficit and market imperfections in the farm-to-fork supply chain. Such action would be far more credible and effective in quelling inflation expectations instead of periodic assertions that prices will cool in a couple of months. What we have instead is further stimulation through a 17-30% wage hike through indexation of the Mahatma Gandhi National Rural Employment Guarantee Scheme wages to the Consumer Price Index for agricultural labourers.
Unsurprisingly, inflation expectations look set to be entrenched at higher levels, only a step short of triggering a price-wage spiral. The central bank’s own survey for July-September 2010 showed household inflation expectations to rise further—from the current perceived 12.1%—to 12.3% in the next one quarter (Oct-Dec 2010) and to 12.7% one year ahead. Though the Reserve Bank of India (RBI) raised interest rates five times, and cash reserve requirements twice in 2010, nominal GDP grew at 19.5% and 18% in the first two quarters of 2010-11, rendering the policy rate at 6.25%—too low a floor. And real interest rates—the difference between the 10-year bond yield and WPI inflation—again turned negative in December.
It is no surprise that RBI has already signalled an increase in interest rates, asserting its determination to restrain inflation. The rise—largely expected to be 25 basis points—will be accompanied by an upward revision to the central bank’s end-year forecast of 6.0% (6.5 or 7.0%?). Recent comments by RBI governor D. Subbarao that the central bank is desperate to control inflation make one doubt that the hike may be even 50 basis points though the declining momentum in industrial production may offset this. Even so, the average 8.9% GDP growth in the first half of 2010-11 may prompt RBI to revise its growth projections as well.
Later, RBI will also have to take the blame for slowing growth. But then, central banks are always the whipping boys for others.
Sunday, January 23, 2011
Is Indian Economy Overheating?
Many people might be wondering why I am talking about overheating of an economy in the midst of recovery from present financial crisis. Particularly many people may not agree with the Indian Economy overheating concept that too when November IIP numbers are below 3% (2.7% to be exact), Stock market corrected almost 10% in last two months compared to its peers which gained 5%-10% at the same time and etc...
But if you see the inflation number what India is facing from last two years is above RBI's comfort zone of 5% to 6%. For the year 2009 Indian Consumer Price Index was of 8.3% averaged and where as 2010 CPI was 10.9%. Where as from 2003 to 2008 Indian consumer price index moved between 3% to 6% on average basis. So in these last two years Indian inflation went up by 4% points in the consumer price index level. In this inflation CPI or WPI, food inflation has been major contributor towards the both indexes.
Many analysts say Inflation is the problem of supply side constraint not demand side. And their point is supply side constraint is because of the structural issues we have in India (apart from abnormal rain inside India and outside of India). But what my point is "all these structural issues were in India from last 50 odd years or so, but we never faced such a consistently long inflation particularly on food side!". Now I feel we as a country might be growing much faster than we ourselves can't handle the growth!
I feel India is facing wage inflation, it is condition where in higher wages or increased wages chase little goods available in the market and causing increase in the prices of the goods and in turn putting pressure on wages to hike. Its like a spiraling or vicious circle. Here I would like to mention just one example of this wage inflation putting pressure on food or overall inflation. When I was posting about Decoupling theory, I mentioned about National Rural Employment Guaranty Scheme (NREGS), which government announced in 2005 and implemented fully in the midst of financial crisis. Under this scheme rural households are guaranteed for 100 days work in a year with the minimum 100 rupees wage per day. This has been the biggest contributor to the rural income and expendable amount in rural hand considering more than half of the Indian population is in rural areas. And most of the NRGS' works are related to infrastructure works, which is causing a real shortage of people in the agricultural fields, which in turn causing increase in the wages of the people who are ready to come for agricultural related.
So all this is leading to more spending from rural India, causing increase in the overall demand side also! Otherwise all these years whole India was divided into two parts like Demanding-Urban and Supplying-Rural. First part, that is urban (demanding side) is same or we can say it increased more, but more importantly rural (supply side) is also facing a demand pressure making it (inflation) look like a supply side constraint! That does not mean that we don't have supply side constraint, we do have supply side constraints, structural issues to reform for longer term solution and etc.
But are we ready to face the current situation and upcoming situations???
Thursday, January 20, 2011
Nifty Has Broken Bull Market Trendline
--> Last many corrections (Bull Market Corrections) found support level at lower end of trend line keeping market in bullish trend
--> At Present Nifty is trading at below Bull market trend line but above 200 day moving average (5610) which is also 50% retracement level in Fibonacci level (5664).
--> Nifty also formed short term bearish trend from Mid November, which should either end 5550 level (Which is also almost 12%-13% correction from top, which is also highest correction in present rally corrections') by finding support at that level or Bear Market...5300-5500 range to start with...
Thursday, January 13, 2011
Friday, January 7, 2011
Comparison between my Decoupling theory... post and Today's mint column
My yesterday’s post in my blog | Today’s mint column (from Bloomberg) |
Decoupling theory depends on structural issues Whenever world is in economical crisis or in boom period, a school thought start talking about decoupling of certain regions or countries from rest of the world saying that particular region is well protected due to certain reasons.
| Decoupling theory. The bubble here is the unsustainable belief that Asia can grow rapidly no matter what happens among the biggest economies. Don’t bet on it. It’s great that China is growing 9.6% and that India is zooming along at 8.9%. Nothing, though, would serve Asia better than a rebound in growth in the US, euro zone, Japan and the UK, which combined make up $34 trillion in annual output. Asia has done a stellar job staying afloat since Wall Street’s collapse in 2008. Developing economies may be able to live for a couple of years without the majors. Good luck keeping up that performance in the year ahead.
Currency reserves.
Link: http://www.livemint.com/2011/01/07003454/Bubbles-will-make-it-a-year-to.html#
|
Decoupling theory depends on structural issues
Many times in my previous postings I talked about the cent percent decoupling in present globalized is not possible. But to a certain extent a region or a country can be decoupled from the rest of the world only on its own structural issues.
Starting from present financial crisis we can take lot of examples where certain parts of the world are in crisis and other parts are not or not affectedly as badly as those. Now so called developed countries like US, UK, Japan, and majority part of Euro Zone are in the threat of double dip recession of deflation, where as BRIC (Brazil, Russia, China & India) countries, Australia and certain African countries are facing threat of Inflation or we can say they are reaching their previous growth trajectory.
India is on the high growth trajectory due to structural issues like domestic savings' pattern (which is of 33% to 35% compared with 2% of US), consumption oriented economy (60% of total country's GDP consumed within India), demographics (55% to 60% of the population is under the age of 26 years), cost effective nature of the companies (which applies to China also), fiscal schemes like NREGS adopted by central government during the slowdown (rather than just monetary policies or so called quantitative easing which have limitation of after certain level like liquidity trap or leakage of money supply due to Interst Rate Parity). Now talking about Inflation which presently is the biggest threat to India's real GDP growth, again due to structural issues like: sudden increase in expendable income of rural household due to NREGS scheme, non-efficiency of public distribution system (PDS) along with supply side problem due to uneven rainfall in certain parts of the country and as usual growth comes with some inflation. According to yesterday's mint, IMF advised India to keep on hiking the interest to cool the inflation, an example of decoupling compared with problem facing countries'.
Now coming to China, the second fastest growing economy, as everybody knows its an export oriented country, but if it is only dependent on export oriented then it should have been in the same position that of US. But its not, in fact it is clicking double digit growth, due to:
1. Massive stimulus package of 4 trillion Yuan, they got from Chinese government of which they spent more than 80 percent, (i.e. more than 3 trillion Yuan on overall infrastructure, which is stepping stone for a country)
2. More than 9 trillion Yuan (more than double of government stimulus) loan disbursement of Chinese banks towards their countrymen lead to massive spending from Chinese towards their internal consumption.
3. Solid current account surplus of whopping $2.6 trillion due to continuous intervention in the forex market to keep Yuan undervalued to help the exporters.
And from inflation point of view, China is also facing similar kind of situation as that of India. Chinese real interest are deep in red due to as low as almost 2% deposit rate and about 5% inflation, which is again divergence from US, UK and Japan.
So similar respective things helped different countries domestically keep the growth momentum
--- Will be continued...
Saturday, January 1, 2011
Highlights of Year 2010 and Decade...
Second, I decided to take serious resolution first-time in life for new year as to read more and write more personally and professionally!
Now coming to today's topic, year 2010 has been very interesting for markets due to various reasons and witnessed a lot. From these, I have collected 10 important information from www.moneycontrol.com and www.economictimes.com, so thought of sharing with you guys...
- The Sensex and Nifty rallied 17% each this year while the midcap index is up 16%.
- The commodities markets have also seen a significant upside with crude being up 13%.
- Gold has seen appreciation of 28% this year.
- Silver has been best asset class in 2010 in comparison with all others as it gained 81%.
- The total investor wealth, measured in terms of cumulative market capitalisation of all listed companies, rose to Rs 72,96,725.14 crore, from Rs 60,79,000 crore at the end of 2009. During the period, the Sensex rose from 17,464.81 points on December 31, 2009 to 20,509.09 points today.
- As end 2010 is also end of the decade, lets look at the performance Indian markets in this decade. On January 1, 2001, the total market capitalization of the Bombay Stock Exchange was about Rs. 700,000 crore, that is USD 150 billion. Currently, the total market capitalization of BSE is about Rs. 70,70,000 crore, that is USD 1570 billion. This means, the BSE has added about Rs 63,70,000 crore of additional market cap over the past decade, indicating a 9 times increase in market cap over the past decade.
- At the beginning of the decade, the Sensex was at 3972. Currently, it is trading at 20,527, a 416% rise over the past decade. In other words, if somebody had invested Rs 100,000 in the Sensex at the beginning of the decade, it would have currently become Rs 516,792.
- Now coming to2010 again, this year FII inflows have been the highest ever in India's history at USD 28.6 billion in nine and a half months. In 2009, FIIs invested USD 17.6 billion while the year before in 2008, India registered foreign investors inflows of USD 12.7 billion. One-third of the total FII inflows this year went into the primary market.
- MF outflows for the year stood at USD 6 billion, also the highest ever in history. A year ago, outflows stood at USD 1.17 billion. Domestic insurance inflows however have seen a steady decline over the last two years. For the year, they came in at a moderate USD 1.5 billion, as against the USD 7 billion registered in 2009 and USD 13.6 billion in 2008.
- Domestic insurance inflows however have seen a steady decline over the last two years. For the year, they came in at a moderate USD 1.5 billion, as against the USD 7 billion registered in 2009 and USD 13.6 billion in 2008.
Top 10 Mid-cap gainers...
Top 10 Mid-cap losers...
Top 10 Small-cap Gainers...
Top 10 BIG-SURPRISE GAINERS...
Global Index Performances(over three crisis years)...