Showing posts with label Market. Show all posts

Monday, May 2, 2011

Updates...

Markets...

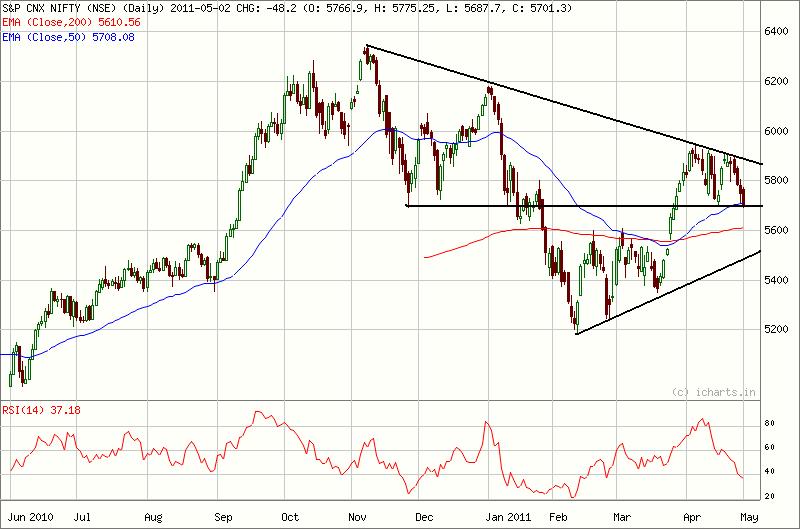
Posting from home, Belgaum, market still looks to be in a symmetrical triangle as tops and bottoms are still tapering out. Nifty has handsome support at 5700, i.e. 50 EMA (Exponential Moving Average) and 5600 i.e. 200 EMA. Maintaining my previous view of break below these above mentioned levels should be short or book profit and break above 5900 i.e. present supply zone, should fresh buying.
RBI...

Today, a day before RBI's meeting on Monetary policy review for 2011, RBI has released Macroeconomic and Monetary Developments in 2010-11, and highlights are as follows...

Growth in 2011-12 is expected to stay close to the trend. Growth risks emanate from high oil prices and some moderation in investment. Business expectations surveys exhibit moderation. Survey of professional forecasters also predicts weaker growth and firmer inflation.

Inflation may remain elevated for some more time despite the current anti-inflationary bias in the monetary stance. Upside risks to inflation arise from high oil and other commodity prices, incomplete pass through and its likely impact on fiscal deficit, elevated inflation expectations and price stickiness.

Global recovery has advanced, but downside risk to global growth arises from oil prices and significant sovereign and banking sector default risks.

GDP growth during 2010-11 reverted to its recent trend, aided by a rebound in agricultural growth. Non-agricultural growth, however, was slightly below trend.

Industrial growth decelerated in the second half on account of high base effect and moderation in investment demand. Manufacturing activity was spread more evenly and the recent slowdown in IIP was exacerbated by volatility in output of a few industries.

Headline inflation exhibited strong persistence in 2010-11 due to supply-side shocks and gradual generalisation of price pressures.

Inflation drivers have changed over three distinct phases. Headline inflation during 2010-11 was impacted primarily by food inflation during April-July, by primary non-food articles during August-November and in a more generalised manner by non-food manufacturing articles since December 2010.

Wednesday, April 20, 2011

Markets in a crucial Symmetrical Triangle


In my last post about Indian markets I mentioned about Nifty's trading range of 5400-5800. I am glad that I was right on lower end and slightly wrong on upper end of the range. Now it seems Nifty is hanging in between 5400-5900, a 500 points trading zone.

After rapid rise from 5400 to 5900 in a very short period, Nifty was expected to see some consolidation/profit booking. After unsuccessful try of breaking above 5900, Nifty witnessed some selling pressure and looks like it found support at 21 DMA/previous support of 5700.

In above chart, it looks like Nifty (or markets) is/are in a Symmetrical triangle, where in tops are topping out and bottoms are bottoming out indicating for a possible narrow range for immediate time frame and final breakout/breakdown after that.

Compared to other two triangle formations (Ascending and Descending), Symmetrical triangle(for more information on triangles, click here) is not a directional indicator, because it can be broken on either side. On higher side, if Nifty crosses 5900/5950 stays above for couple of days then the possible breakout is possible and on lower side as long as Nifty holds 5700 and 5600 levels, it is safe to maintain our longs.

Saturday, March 26, 2011

Nifty range may be shifting from 5200-5600 to 5400-5800

Friday Indian markets witnessed almost 2.5% gain in their both leading indicators Sensex and Nifty crossing their immediate individual resistance levels. Today's mint headline reads, Sensex gaining 1000 points in this week, and thats way, I think Indian markets are reacting because of being laggard through out the this year after witnessing sharp rallies in September and November 2010.

Indian markets have priced in Middle east crisis, In turn causing oil spikes (which I believe is temporary as it is not in synchronized with the world recovery. Since almost oil price jumped an average of $70 to more than $100, which is more than 40% rise.) Japanese earthquake effect and RBI's recent rate hike.

If you go by the pure technical charts which is as given below from mid February Nifty is trying to make higher bottoms and higher tops, which is according to Dow theory is a positive sign.


Exponential moving average (which are better indicators of the recent trend as compared with Simple Moving Average) of 50 and 200 days indicate possible reversal in the trend due to possible crossovers.

The one of the major oscillator, RSI (Relative Strength Indicator) is also indicating consolidated upward movement strength in the recent trend from March 2nd week.

Now coming to base formation before jumping to next range, the market looks like it formed the base at 5200 as it bounced back twice and after that it formed intermediate support at 5400 as it was trading in the range of that 5400-5600.

Now coming to upper band of the new range, that is the resistance level for the market would be the 5800 levels. That is the level when Nifty was having support when it was falling in November and December months.

Now finally coming to options, 5400 Put option has seen the more than 11 million contracts open interest and more than 1 million contracts change in the open interest (highest for any PUT option) indicating the PUT option sellers feel the base for the market is at 5400 levels. From CALL option perspective both 5700 and 5800 contracts witnessed highest levels of open interest and 5800 CALL option has seen maximum change in the open interest, indicating option writers feeling resistance at 5800 levels.

Tuesday, March 8, 2011

Range-bound Nifty

As I mentioned in my February posts, Nifty has been trading in the range bound (5200-5600) after that correction from 5700/5800 levels to 5200. The same is shown in the below charts...

As we believe in Technical analysis all the news in the market will reflect in the price of the market, that means no need to look out for anything else like recent Libya crisis, Oil rally, Budget, Egyptian crisis, governance issues and etc.

Going by the above statement, that is Price reflecting everything, consider the moving averages of different time frames like 21, 50 and 200 day moving averages. 21 day SMA is at 5400 and is acting as immediate support to the market, and 50 day SMA and 200 day SMA are almost 5650 levels which will act as resistance as of now. And one more conclusion we can draw from the below chart 50 DMA (or SMA) goes on below 200 DMA then it will be considered as negative for the markets.


If you see the below chart, the trend lines attaching recent tops of the market has immediate supply zone/resistance at 5600 where it made double tops (marked in circles) and 5980 at resistance at higher levels.

And going by options data, 5400 Put option and 5700 call option have seen maximum change in the open interest according to NSE website, indicating possible ranges for the market for this series.


Friday, February 18, 2011

Nifty levels...


5200: Intermediate bottom
5400: Possible support as of now
5700: Next Possible resistance
5200-5700: Possible range of consolidation


Monday, February 14, 2011

Pullback in Nifty is sustainable above 5520/5560

A pullback rally of more than 250 points in Nifty in 2 days is sustainable only if Nifty crosses over over 5520/5560 level and trades above that level. Otherwise it can be considered as dead cat bounce back.

When I checked Nifty daily chart for last one year I could make out the certain interesting findings like Nifty moved in a trading range for almost 8-9 months. As marked in the chart, from June, 2010 Nifty moved in a trading range like...

June to Aug -- Nifty range from 5200 to 5600 -- 400 Points consolidated rally
September -- Nifty range from 5600 to 6100 -- 500 Points sharp rally
Oct to Nov -- Nifty range from 6000 to 6350 -- 350 points consolidation
November -- Nifty range from 6000 to 5700 -- 300 points correction
Dec to Jan -- Nifty range from 5700 to 6200 -- 500 points consolidation
Jan to Feb -- Nifty range from 5700 to 5200 -- 500 points sharp correction

From above table of information we can decipher a simple conclusion that, a rally (400 points) is followed sharper-one (500 points) and then consolidation (350points) and a correction (300 points), small consolidation and then sharper-one (500 points correction).


So from above daily chart and weekly charts, I think we can expect one round of consolidation may happen before next leg of rally (above 5520/5560) or correction (below 5100 may take Nifty to 4800 as indicated in charts). That range of consolidation may be from trading of 5200 to 5600/5700 which is also of 400-500 points consolidation.


Tuesday, February 8, 2011

Nifty may bottom out around 5100/5200

As Nifty breached a major psychological level of 5400, (which most of the analysts, including me thought market would hold on), it made market participants to lower their respective new targets for it.

So I checked for Nifty daily, weekly and monthly charts to find out the trend lines and possible (!!!) support for the market in this relentless selling from big boys...

On daily charts, it can be seen that Nifty traded between 4900-5200 levels for almost an year from September 2009 to August 2010 till it broke out of the range due to biggest inflow of FIIs ever in the history of Indian markets (of $5 billion in a September month). So whenever Nifty corrected in that range it found support at 5200 and 5100 levels on intermediate basis. Another factor is, oversold zone in the RSI, i.e. below 30 levels is trading and it happened only 3 times in last 15-18 months.

On Weekly charts, two main things can be noticed... First is 100 EMA is at 5160 and second is trend line connecting the bottoms (whenever market corrected) is supporting the 100 EMA on Nifty. RSI on Weekly charts is about to touch the lowest level, the level at which RSI traded when Nifty was trading at 2500 levels.

On monthly charts, Nifty clearly formed double top formation around 6300 levels which is a trend reversal signal in technical theory. Around 5100/5200 this double top formation may form a neckline as it supported by 21 EMA, trend line and consolidation range are pointing to 5200 levels.

Bottom line:
And if you see the option data in NSE website, 5100 put option and 5400 call option have witnessed maximum change in the open interest for February series, indicating heavy selling/writing off of these options at these strike levels giving hint for a range for the market.


Friday, January 28, 2011

First time in 9 months Nifty closed below 200 day moving average

Today first time in 9 months Nifty closed below 200 DMA (day moving average) followed by break in trend line last week. This correction in the market is sharpest in 9 months apart from one correction in May 2009 (when market corrected from 4600 to 4000 levels of 13.3%), about which I mentioned in my posting.

When Nifty started correcting from 6000 levels in November which is also 23.6% retracement level in Fibonacci retracement from top 6350 levels. From November Nifty started making bear market trend which is shown in the graph. At present that trend-line is ending at 5400 levels which is also 61.8% retracement level in Fibonacci and also Nifty has consolidated at this level for 2 months in July and August in 2010.

And also we can observe similar trend-line in RSI, where line meeting top line, line meeting intermediate top line and line meeting bottom lines are indicating the correction.

Interestingly, I got a graph (from one of the blog which I follow) which shows DIIs (Domestic Institutional Investors) and FIIs (Foreign Institutional Investors) price action and Nifty movement. From the below picture we can observe that in last 15days FIIs were net sellers almost everyday and Nifty either corrected or consolidate everyday in conjunction with FII flows.

Thursday, January 20, 2011

Nifty Has Broken Bull Market Trendline

--> From last 8 months was trading above 200 day moving average and trend line

--> Last many corrections (Bull Market Corrections) found support level at lower end of trend line keeping market in bullish trend

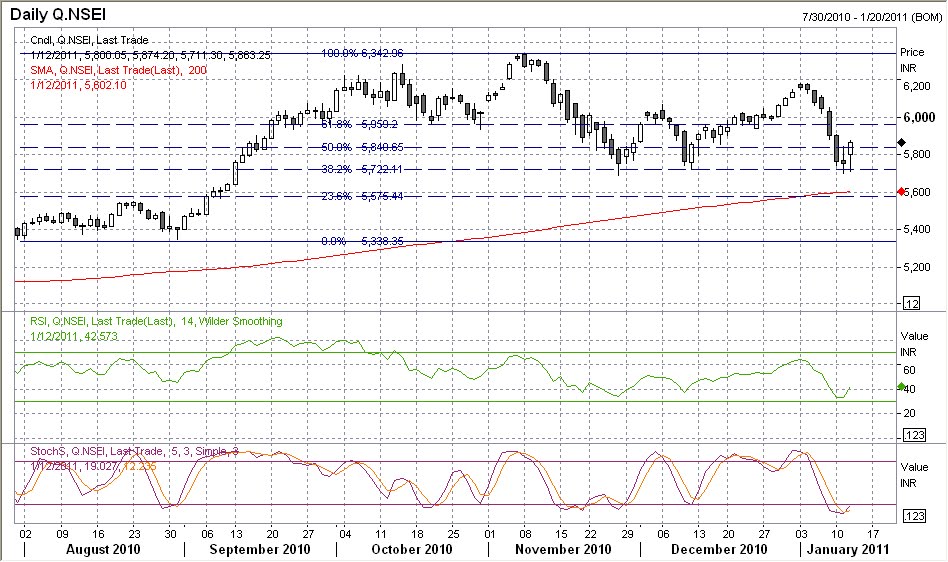
--> At Present Nifty is trading at below Bull market trend line but above 200 day moving average (5610) which is also 50% retracement level in Fibonacci level (5664).

--> Nifty also formed short term bearish trend from Mid November, which should either end 5550 level (Which is also almost 12%-13% correction from top, which is also highest correction in present rally corrections') by finding support at that level or Bear Market...5300-5500 range to start with...

Saturday, January 1, 2011

Highlights of Year 2010 and Decade...

First, I wish all my friends and readers a very happy new year 2011.
Second, I decided to take serious resolution first-time in life for new year as to read more and write more personally and professionally!
Now coming to today's topic, year 2010 has been very interesting for markets due to various reasons and witnessed a lot. From these, I have collected
10 important information from www.moneycontrol.com and www.economictimes.com, so thought of sharing with you guys...

  1. The Sensex and Nifty rallied 17% each this year while the midcap index is up 16%.
  2. The commodities markets have also seen a significant upside with crude being up 13%.
  3. Gold has seen appreciation of 28% this year.
  4. Silver has been best asset class in 2010 in comparison with all others as it gained 81%.
  5. The total investor wealth, measured in terms of cumulative market capitalisation of all listed companies, rose to Rs 72,96,725.14 crore, from Rs 60,79,000 crore at the end of 2009. During the period, the Sensex rose from 17,464.81 points on December 31, 2009 to 20,509.09 points today.
  6. As end 2010 is also end of the decade, lets look at the performance Indian markets in this decade. On January 1, 2001, the total market capitalization of the Bombay Stock Exchange was about Rs. 700,000 crore, that is USD 150 billion. Currently, the total market capitalization of BSE is about Rs. 70,70,000 crore, that is USD 1570 billion. This means, the BSE has added about Rs 63,70,000 crore of additional market cap over the past decade, indicating a 9 times increase in market cap over the past decade.
  7. At the beginning of the decade, the Sensex was at 3972. Currently, it is trading at 20,527, a 416% rise over the past decade. In other words, if somebody had invested Rs 100,000 in the Sensex at the beginning of the decade, it would have currently become Rs 516,792.
  8. Now coming to2010 again, this year FII inflows have been the highest ever in India's history at USD 28.6 billion in nine and a half months. In 2009, FIIs invested USD 17.6 billion while the year before in 2008, India registered foreign investors inflows of USD 12.7 billion. One-third of the total FII inflows this year went into the primary market.
  9. MF outflows for the year stood at USD 6 billion, also the highest ever in history. A year ago, outflows stood at USD 1.17 billion. Domestic insurance inflows however have seen a steady decline over the last two years. For the year, they came in at a moderate USD 1.5 billion, as against the USD 7 billion registered in 2009 and USD 13.6 billion in 2008.
  10. Domestic insurance inflows however have seen a steady decline over the last two years. For the year, they came in at a moderate USD 1.5 billion, as against the USD 7 billion registered in 2009 and USD 13.6 billion in 2008.
Apart from index based news I have taken some stock specific news and global index movements, of which I am posting top 10 companies' stocks (Mid caps and Small Caps only) details below...

Top 10 Mid-cap gainers...

Top 10 Mid-cap losers...

Top 10 Small-cap Gainers...

Top 10 BIG-SURPRISE GAINERS...

Global Index Performances(over three crisis years)...