Gautam Shah of JM Financial talking about technical's of Indian markets. He is one of finest readers of technicals of markets and according to him, market is in the consolidation range from January's rally and could rally to a level of 5750-5800 if it breaks out 5350 with concise volume and conviction. He is bullish on Banking sector, ADAG pack and Indian Rupee.
Showing posts with label Technical Analysis. Show all posts
Showing posts with label Technical Analysis. Show all posts
Friday, April 20, 2012
Fundamental & Technical Views
Ajay Shah's interview in CNBC about macro economy and fundamentals. He is talking about RBI's surprise rate cut move, inflation threat (CPI numbers versus WPI numbers and their respective combination), robust revenue growth of listed companies, dilemma of IIP numbers and GDP data from CSO, economic problems (obviously not BOP crisis like early 90s).


Wednesday, April 20, 2011
Markets in a crucial Symmetrical Triangle

In my last post about Indian markets I mentioned about Nifty's trading range of 5400-5800. I am glad that I was right on lower end and slightly wrong on upper end of the range. Now it seems Nifty is hanging in between 5400-5900, a 500 points trading zone.
After rapid rise from 5400 to 5900 in a very short period, Nifty was expected to see some consolidation/profit booking. After unsuccessful try of breaking above 5900, Nifty witnessed some selling pressure and looks like it found support at 21 DMA/previous support of 5700.
In above chart, it looks like Nifty (or markets) is/are in a Symmetrical triangle, where in tops are topping out and bottoms are bottoming out indicating for a possible narrow range for immediate time frame and final breakout/breakdown after that.
Compared to other two triangle formations (Ascending and Descending), Symmetrical triangle(for more information on triangles, click here) is not a directional indicator, because it can be broken on either side. On higher side, if Nifty crosses 5900/5950 stays above for couple of days then the possible breakout is possible and on lower side as long as Nifty holds 5700 and 5600 levels, it is safe to maintain our longs.
Saturday, March 26, 2011
Nifty range may be shifting from 5200-5600 to 5400-5800
Friday Indian markets witnessed almost 2.5% gain in their both leading indicators Sensex and Nifty crossing their immediate individual resistance levels. Today's mint headline reads, Sensex gaining 1000 points in this week, and thats way, I think Indian markets are reacting because of being laggard through out the this year after witnessing sharp rallies in September and November 2010.
Indian markets have priced in Middle east crisis, In turn causing oil spikes (which I believe is temporary as it is not in synchronized with the world recovery. Since almost oil price jumped an average of $70 to more than $100, which is more than 40% rise.) Japanese earthquake effect and RBI's recent rate hike.
If you go by the pure technical charts which is as given below from mid February Nifty is trying to make higher bottoms and higher tops, which is according to Dow theory is a positive sign.

Exponential moving average (which are better indicators of the recent trend as compared with Simple Moving Average) of 50 and 200 days indicate possible reversal in the trend due to possible crossovers.
The one of the major oscillator, RSI (Relative Strength Indicator) is also indicating consolidated upward movement strength in the recent trend from March 2nd week.
Now coming to base formation before jumping to next range, the market looks like it formed the base at 5200 as it bounced back twice and after that it formed intermediate support at 5400 as it was trading in the range of that 5400-5600.
Now coming to upper band of the new range, that is the resistance level for the market would be the 5800 levels. That is the level when Nifty was having support when it was falling in November and December months.
Now finally coming to options, 5400 Put option has seen the more than 11 million contracts open interest and more than 1 million contracts change in the open interest (highest for any PUT option) indicating the PUT option sellers feel the base for the market is at 5400 levels. From CALL option perspective both 5700 and 5800 contracts witnessed highest levels of open interest and 5800 CALL option has seen maximum change in the open interest, indicating option writers feeling resistance at 5800 levels.
Indian markets have priced in Middle east crisis, In turn causing oil spikes (which I believe is temporary as it is not in synchronized with the world recovery. Since almost oil price jumped an average of $70 to more than $100, which is more than 40% rise.) Japanese earthquake effect and RBI's recent rate hike.
If you go by the pure technical charts which is as given below from mid February Nifty is trying to make higher bottoms and higher tops, which is according to Dow theory is a positive sign.

Exponential moving average (which are better indicators of the recent trend as compared with Simple Moving Average) of 50 and 200 days indicate possible reversal in the trend due to possible crossovers.
The one of the major oscillator, RSI (Relative Strength Indicator) is also indicating consolidated upward movement strength in the recent trend from March 2nd week.
Now coming to base formation before jumping to next range, the market looks like it formed the base at 5200 as it bounced back twice and after that it formed intermediate support at 5400 as it was trading in the range of that 5400-5600.
Now coming to upper band of the new range, that is the resistance level for the market would be the 5800 levels. That is the level when Nifty was having support when it was falling in November and December months.
Now finally coming to options, 5400 Put option has seen the more than 11 million contracts open interest and more than 1 million contracts change in the open interest (highest for any PUT option) indicating the PUT option sellers feel the base for the market is at 5400 levels. From CALL option perspective both 5700 and 5800 contracts witnessed highest levels of open interest and 5800 CALL option has seen maximum change in the open interest, indicating option writers feeling resistance at 5800 levels.
Tuesday, March 8, 2011
Range-bound Nifty
As I mentioned in my February posts, Nifty has been trading in the range bound (5200-5600) after that correction from 5700/5800 levels to 5200. The same is shown in the below charts...
As we believe in Technical analysis all the news in the market will reflect in the price of the market, that means no need to look out for anything else like recent Libya crisis, Oil rally, Budget, Egyptian crisis, governance issues and etc.
Going by the above statement, that is Price reflecting everything, consider the moving averages of different time frames like 21, 50 and 200 day moving averages. 21 day SMA is at 5400 and is acting as immediate support to the market, and 50 day SMA and 200 day SMA are almost 5650 levels which will act as resistance as of now. And one more conclusion we can draw from the below chart 50 DMA (or SMA) goes on below 200 DMA then it will be considered as negative for the markets.

If you see the below chart, the trend lines attaching recent tops of the market has immediate supply zone/resistance at 5600 where it made double tops (marked in circles) and 5980 at resistance at higher levels.

And going by options data, 5400 Put option and 5700 call option have seen maximum change in the open interest according to NSE website, indicating possible ranges for the market for this series.
Friday, February 18, 2011
Nifty levels...

5200: Intermediate bottom
5400: Possible support as of now
5700: Next Possible resistance
5200-5700: Possible range of consolidation
Monday, February 14, 2011
Pullback in Nifty is sustainable above 5520/5560
A pullback rally of more than 250 points in Nifty in 2 days is sustainable only if Nifty crosses over over 5520/5560 level and trades above that level. Otherwise it can be considered as dead cat bounce back.

When I checked Nifty daily chart for last one year I could make out the certain interesting findings like Nifty moved in a trading range for almost 8-9 months. As marked in the chart, from June, 2010 Nifty moved in a trading range like...
June to Aug -- Nifty range from 5200 to 5600 -- 400 Points consolidated rally
September -- Nifty range from 5600 to 6100 -- 500 Points sharp rally
Oct to Nov -- Nifty range from 6000 to 6350 -- 350 points consolidation
November -- Nifty range from 6000 to 5700 -- 300 points correction
Dec to Jan -- Nifty range from 5700 to 6200 -- 500 points consolidation
Jan to Feb -- Nifty range from 5700 to 5200 -- 500 points sharp correction
From above table of information we can decipher a simple conclusion that, a rally (400 points) is followed sharper-one (500 points) and then consolidation (350points) and a correction (300 points), small consolidation and then sharper-one (500 points correction).

So from above daily chart and weekly charts, I think we can expect one round of consolidation may happen before next leg of rally (above 5520/5560) or correction (below 5100 may take Nifty to 4800 as indicated in charts). That range of consolidation may be from trading of 5200 to 5600/5700 which is also of 400-500 points consolidation.
Tuesday, February 8, 2011
Nifty may bottom out around 5100/5200
As Nifty breached a major psychological level of 5400, (which most of the analysts, including me thought market would hold on), it made market participants to lower their respective new targets for it.
So I checked for Nifty daily, weekly and monthly charts to find out the trend lines and possible (!!!) support for the market in this relentless selling from big boys...

On daily charts, it can be seen that Nifty traded between 4900-5200 levels for almost an year from September 2009 to August 2010 till it broke out of the range due to biggest inflow of FIIs ever in the history of Indian markets (of $5 billion in a September month). So whenever Nifty corrected in that range it found support at 5200 and 5100 levels on intermediate basis. Another factor is, oversold zone in the RSI, i.e. below 30 levels is trading and it happened only 3 times in last 15-18 months.

On Weekly charts, two main things can be noticed... First is 100 EMA is at 5160 and second is trend line connecting the bottoms (whenever market corrected) is supporting the 100 EMA on Nifty. RSI on Weekly charts is about to touch the lowest level, the level at which RSI traded when Nifty was trading at 2500 levels.

On monthly charts, Nifty clearly formed double top formation around 6300 levels which is a trend reversal signal in technical theory. Around 5100/5200 this double top formation may form a neckline as it supported by 21 EMA, trend line and consolidation range are pointing to 5200 levels.
Bottom line:
And if you see the option data in NSE website, 5100 put option and 5400 call option have witnessed maximum change in the open interest for February series, indicating heavy selling/writing off of these options at these strike levels giving hint for a range for the market.
Friday, January 28, 2011
First time in 9 months Nifty closed below 200 day moving average
Today first time in 9 months Nifty closed below 200 DMA (day moving average) followed by break in trend line last week. This correction in the market is sharpest in 9 months apart from one correction in May 2009 (when market corrected from 4600 to 4000 levels of 13.3%), about which I mentioned in my posting.
 When Nifty started correcting from 6000 levels in November which is also 23.6% retracement level in Fibonacci retracement from top 6350 levels. From November Nifty started making bear market trend which is shown in the graph. At present that trend-line is ending at 5400 levels which is also 61.8% retracement level in Fibonacci and also Nifty has consolidated at this level for 2 months in July and August in 2010.
And also we can observe similar trend-line in RSI, where line meeting top line, line meeting intermediate top line and line meeting bottom lines are indicating the correction.
Interestingly, I got a graph (from one of the blog which I follow) which shows DIIs (Domestic Institutional Investors) and FIIs (Foreign Institutional Investors) price action and Nifty movement. From the below picture we can observe that in last 15days FIIs were net sellers almost everyday and Nifty either corrected or consolidate everyday in conjunction with FII flows.

 When Nifty started correcting from 6000 levels in November which is also 23.6% retracement level in Fibonacci retracement from top 6350 levels. From November Nifty started making bear market trend which is shown in the graph. At present that trend-line is ending at 5400 levels which is also 61.8% retracement level in Fibonacci and also Nifty has consolidated at this level for 2 months in July and August in 2010.
And also we can observe similar trend-line in RSI, where line meeting top line, line meeting intermediate top line and line meeting bottom lines are indicating the correction.
Interestingly, I got a graph (from one of the blog which I follow) which shows DIIs (Domestic Institutional Investors) and FIIs (Foreign Institutional Investors) price action and Nifty movement. From the below picture we can observe that in last 15days FIIs were net sellers almost everyday and Nifty either corrected or consolidate everyday in conjunction with FII flows.

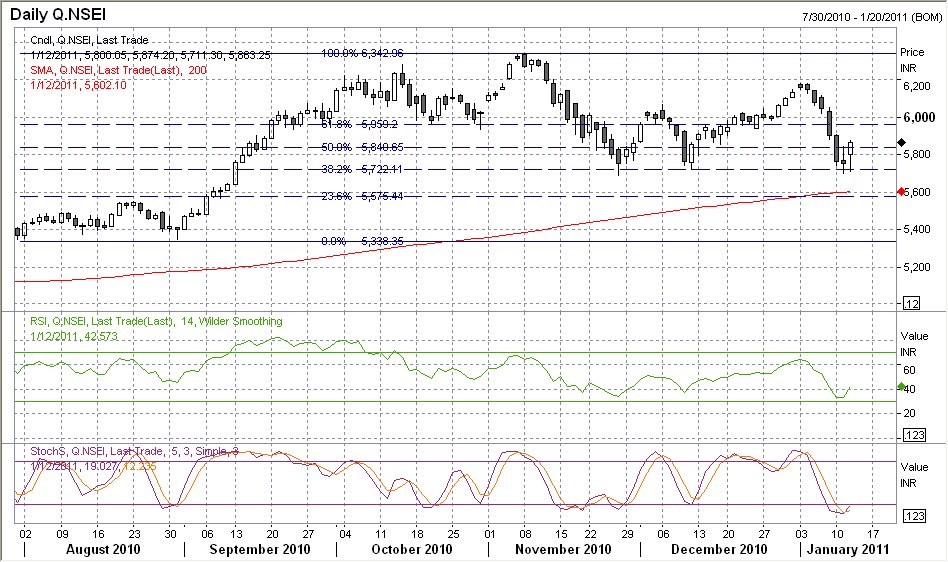
Thursday, January 20, 2011
Nifty Has Broken Bull Market Trendline
 --> From last 8 months was trading above 200 day moving average and trend line
--> Last many corrections (Bull Market Corrections) found support level at lower end of trend line keeping market in bullish trend
--> At Present Nifty is trading at below Bull market trend line but above 200 day moving average (5610) which is also 50% retracement level in Fibonacci level (5664).
--> Nifty also formed short term bearish trend from Mid November, which should either end 5550 level (Which is also almost 12%-13% correction from top, which is also highest correction in present rally corrections') by finding support at that level or Bear Market...5300-5500 range to start with...
Thursday, January 13, 2011
Monday, November 29, 2010

Saturday, November 27, 2010
Bull market corrections
 Yesterday when I read about Bull market corrections in one of the blog which I follow; I also thought of writing about it in my blog for my readers. In fact I wrote about Bull market corrections two times in my blog in August 2010. Click here 1, 2 for details...
First talking about bull market, the technical definition (according to Dow theory) of the bull market in simple terms is higher highs and higher lows. This means market will make new highs and bottoms after each corrections will be new lows without breaching previous correction's lows.
For your information I have collected some details from this present bull trend (you may call it as market also!) which started from March 2009. First one is above graph in I have shown 5 corrections. For each correction I have collected some more information which is as below...
| Peak level | Bottom level | Correction(Absolute) | Correction(Percentage) |
| 4600 | 4000 | 600 | 13.04 |
| 5120 | 4580 | 540 | 10.55 |
| 5275 | 4725 | 550 | 10.43 |
| 5375 | 4820 | 555 | 10.33 |
| 6310 | 5750 | 560 | 8.87 |
If you see the above table & graph there are some resemblances in each corrections like
1. Each part of bull lasted fro 2 months
2. Following correction from each bull lasted for one month
3. Average correction in Nifty in absolute terms is in the range of 540-600 points
4. Each time Nifty faced correction of 10% to 13% at max
5. Each correction bottomed around either @ 100 day EMA or @ 200 day EMA
6. For each correction RSI had shown oversold point (touching level of 30) each time
Now coming to present correction, Nifty on closing basis started correcting from 6310 levels and closed on Friday at 5750 levels, that is of 560 points fall which is in the range of previous falls. But here there are some differences like
--> In percentage terms it is almost 9% percent, so couple of more percentage fall might be there for Nifty to bottom out and consolidate
--> If you see the RSI, still it is not in oversold zone, that is it is yet to touch 30 levels in the oscillator
--> 200 day EMA is @ 5523 and 100 day EMA is @ 5800 which is already broken on closing basis for 2 days. So I feel Nifty may bottom out and consolidate in the range of 5650 (considering global & country's news flow may not averse) which is another 100 points fall from present level and also 10% fall from the peak which will be in line with the previous falls and within the broad trend.
Wednesday, November 17, 2010
Nifty movement

Will Nifty hold onto October lows of 5940-5950? A big question mark after today's fall. On Ireland debt and China's possible monetary action triggered Asian markets sell off. Whatever may be the reason, charts are predicting the similar patterns what happened during 4800-5500 levels of Nifty between February and May.
Coming to present present fall, Nifty witnessed successive fall forming large "BEARISH ENGULFING" patterns. Nifty for time being should find support at 596o levels, if that level breaks this CORRECTIVE PATTERN should find the 5880-5860 which is also a 100 day moving average support and trend line ending point. Even RSI is also not showing overbought condition in its oscillation. If that breaks then I feel there will be a lot of selling pressure and fresh shorts may be created in the market.
Monday, November 15, 2010
Another possible breakout in Hanung Toys

The stock which I found out at Rs. 120 odd levels around 6 months back now trading at Rs. 400. Now question is not about the finding the stock or price discovery or for that matter stock discovery. Question is price movement along with other technical indicators like volume, MACD Moving Average Convergence & Divergence), RSI (Relative Strength Index) & etc.
As I marked in above graph, every time stock breaks out of consolidation range it moves with large volume with movement in MACD or RSI or Stochastics. So you need to look at all possible angles before you jump into or out of the stock not just by looking at stock price movement.
Saturday, November 13, 2010


Friday, August 27, 2010
Is market leading to bull market correction
Guys I am back with market gyan again...
Couple of times I wrote in last postings that in last one year market has witnessed...
--> 2Months Bull Run
--> 1 Months Bear Run
Now coming to today's topic, I am calling this correction as Bull market correction instead of just a profit booking. Just have look at below 2 charts...


So from these two charts you can notice following points...
--> Market closed below 20 DMA & just above 50 DMA
--> Market closed below psychological level of 5450 & 5420
--> RSI is in downtrend & not yet touched oversold zone.
--> Market has corrected more than 100 points in this correction. In 2nd chart you can see, 3 times profit booking has taken place. And all these time market has corrected exactly or less than 100 points. And also all these times market correction had found support @ 21DMA levels. But this time market has corrected more than 150 points in & also didn't found support @ 21/20 DMA level support.
--> And from world market perspective, our market is resilient in correction & is lagging the trend.
So looking at all these points, I feel market may find supports at 5250 levels & if corrects/breaks this level also then 5000 levels on Nifty would be ideal point for demand side. And also this 500 points correction leads to 10% correction which same as our previous 3-4 correction in this year.
Couple of times I wrote in last postings that in last one year market has witnessed...
--> 2Months Bull Run
--> 1 Months Bear Run
Now coming to today's topic, I am calling this correction as Bull market correction instead of just a profit booking. Just have look at below 2 charts...


So from these two charts you can notice following points...
--> Market closed below 20 DMA & just above 50 DMA
--> Market closed below psychological level of 5450 & 5420
--> RSI is in downtrend & not yet touched oversold zone.
--> Market has corrected more than 100 points in this correction. In 2nd chart you can see, 3 times profit booking has taken place. And all these time market has corrected exactly or less than 100 points. And also all these times market correction had found support @ 21DMA levels. But this time market has corrected more than 150 points in & also didn't found support @ 21/20 DMA level support.
--> And from world market perspective, our market is resilient in correction & is lagging the trend.
So looking at all these points, I feel market may find supports at 5250 levels & if corrects/breaks this level also then 5000 levels on Nifty would be ideal point for demand side. And also this 500 points correction leads to 10% correction which same as our previous 3-4 correction in this year.
Saturday, October 10, 2009
Market is @ crucial point

In my last Friday's post, I said market is looking overbought zone and correction may be due in near term. Compared to last Friday's closing and this Friday closing Nifty lost almost 130 points and standing at very crucial point S1= 4945, S2= 4920.
These levels are the very crucial for the markets. As you can see in above chart, Nifty spot is making almost Double Bottom kind of pattern & all other indicators, Stochastic, MACD & RSI are making Tripple Bottoms. So there is intermediate support at these level which may give little support to the market in coming week.
But if you see the below chart, there still pain left in the market from the 2-3 months perspective. Market is breaching 14 days EMA(Exponential Moving Average), which is considered as the reversal in the trend. And also if you see RSI & Stochastic they are still in downward movement & not in oversold region.

BOTTOM LINE:
So breach of 4920 levels leads to market movement towards 4800 level where market consolidated previously, so has a major support & by then all the GAP UP OPENINGS will be filled!!!
Thursday, October 8, 2009
Have a look @ Bharti Airtel

Short & Medium term investors start thinking about accumulating Telecom sector leading company's stock Bharti Airtel as all the telecom sector stocks crashed down, couple days on the news of per second tariff bill proposed move by TRAI (Telecom Regulatory Authority of India).
Going by Technical charts, all the indicators RSI, Stochastics, MACD & Volume (which is not there in the chart) are in oversold zone. So investors can start accumulating this stock in subsequent steps & not in single move.
As I wrote in my last article/post, market is not holding up the 5100-5150 levels in Nifty. So it is consolidating @ this level or indicating the sluggishness in the present rally. So at this level still I caution short investors to be careful about the levels 4980 & 4950 which are giving major support to Nifty.
In systematic way investors can start looking @ some stocks which are fundamentally strong & also technically in oversold zone...
Friday, October 2, 2009
Market is in overbought zone

Yes, I feel like markets zoomed too much in the wake of excess liquidity flowing in terms of FIIs, DIIs & somewhat retail investors(recently, when they started feeling left out in the present rally) due to various reasons like sound fundamentals, good earning seasons, cheap valuations & etc.
But does all the reasons support a rally from 2600 levels in Nifty to above 5000 levels, that is more than 90% return in period of mere 6 months.
Here I am not going to discuss any fundamentals today, technically markets are in overbought zone according to many chart indicators which I have given above.
In above chart you can see that RSI(Relative Strength Index) & Stochastic are above 80 levels & slightly feeling sluggishness on these levels. And these are the main(particularly RSI) are pre-indicators for the markets' conditions on both the cases (overbought & oversold).
Here I am not saying that market will start correcting immediately, but correction is in due. It may happen from 5250-5300 levels if not immediately because that is the level when markets started sliding more aggressively in April 2008. You can see that in the below chart.

If you see the 1st chart in first week of June 2009 RSI started sliding from overbought zone, i.e. above 80 levels but markets moved further up for couple of days. But after that they corrected from 4700 levels to 400o levels. And in one more case similar to this is 1st week of August 2009 RSI gave the hint and profit booking took place from 4750 levels to 4400 levels. And it applies to Stochastic also which is similar to that of RSI but little bit complicated. And in 2nd chart you can see the decrease in the volume recently.
So here I am advising not go long(buying) in the present conditions. But as I said above, I not advising going short(for F&O players) also on Index immediately. So for traders its okay to take positions on either side(since they track regularly & exit with little bit loss if needed by not minding) but for short & medium investors I would advise to wait for markets to get correct and then start accumulating good bets.
Now question comes, if markets corrects(IF is the big question mark here) then what is the level to enter back into the markets. Thats the million dollar question!
At present condition I dont know, that's why I am not exiting my longs in solid bets & but I have started exiting from other counters(which I believe not blue chip or high beta or whatever you call).
May be 4700-4800 levels are the starting points for getting back into the markets if markets corrects to that level.
Bottom line:
Personally I dont think/want/expect markets to corrects to below 4500 levels (as solid consolidation has taken place 3-4 times during these 6 months period @ 4500 levels) but markets are always right, so go with the markets...
Thursday, September 3, 2009
Technical Analysis - IIII
Neutral Pattern
1. Doji

2. Spinning tops
These are neutral lines. They occur when the distance between the high and low, and the distance between the open and close, are relatively small

3. Harami ("pregnant" in English).
This pattern indicates a decrease in momentum. It occurs when a line with a small body falls within the area of a larger body. In this example, a bullish (empty) line with a long body is followed by a weak bearish (filled-in) line. This implies a decrease in the bullish momentum

Reversal Patterns
1.Dragon-fly doji
This line also signifies a turning point. It occurs when the open and close are the same, and the low is significantly lower than the open, high, and closing prices.

2. Gravestone doji
This line also signifies a turning point. It occurs when the open, close, and low are the same, and the high is significantly higher than the open, low, and closing prices

3. Star
Stars indicate reversals. A star is a line with a small real body that occurs after a line with a much larger real body, where the real bodies do not overlap. The shadows may overlap.

4. Doji star
A star indicates a reversal and a doji indicates indecision. Thus, this pattern usually indicates a reversal following an indecisive period. You should wait for a confirmation (e.g., as in the evening star illustration) before trading a doji star.

1. Doji

2. Spinning tops
These are neutral lines. They occur when the distance between the high and low, and the distance between the open and close, are relatively small

3. Harami ("pregnant" in English).
This pattern indicates a decrease in momentum. It occurs when a line with a small body falls within the area of a larger body. In this example, a bullish (empty) line with a long body is followed by a weak bearish (filled-in) line. This implies a decrease in the bullish momentum

Reversal Patterns
1.Dragon-fly doji
This line also signifies a turning point. It occurs when the open and close are the same, and the low is significantly lower than the open, high, and closing prices.

2. Gravestone doji
This line also signifies a turning point. It occurs when the open, close, and low are the same, and the high is significantly higher than the open, low, and closing prices

3. Star
Stars indicate reversals. A star is a line with a small real body that occurs after a line with a much larger real body, where the real bodies do not overlap. The shadows may overlap.

4. Doji star
A star indicates a reversal and a doji indicates indecision. Thus, this pattern usually indicates a reversal following an indecisive period. You should wait for a confirmation (e.g., as in the evening star illustration) before trading a doji star.

Subscribe to:
Posts (Atom)